The RAIL Project
If you have spoken with me (ever) you've probably gotten an ear-full about the RAIL Project. If not, then I'll say in advance, "You're welcome."
In the fall of 2011 I did my student teaching with Keith
Piccard, an astonishingly talented and energetic sixth-grade science teacher,
who had launched the RAIL Project in the Allendale School district sometime
around 2002. In 2012 I managed to pull off a slightly scaled-back version
of the RAIL Project in my freshman biology sections at Dakota High School, with
good success (and some room for improvement).
The goal was for students to be able to collect and analyze data from fieldwork to make conclusions about a complex natural system. They were able to model nutrient flow and energy flow in the stream and hypothesize food web structure. If we had had more time, students would have also been able to develop their own experiments to use in order to test their own hypotheses about the stream. The RAIL Project took place during a three-chapter long ecology unit, so it fit seamlessly into the curriculum.
The goal was for students to be able to collect and analyze data from fieldwork to make conclusions about a complex natural system. They were able to model nutrient flow and energy flow in the stream and hypothesize food web structure. If we had had more time, students would have also been able to develop their own experiments to use in order to test their own hypotheses about the stream. The RAIL Project took place during a three-chapter long ecology unit, so it fit seamlessly into the curriculum.

In the Google Earth view at left, you can see the Dakota campus (the cluster of reddish buildings) and the location of the stream relative to campus. Students had to march each work day from the Ninth Grade Center (easternmost building), past the sports fields, to the stream (blue line).

Students were able to look at these maps and make observations to augment their fieldwork data.
Riparian Areas
RAIL stands for "Riparian Area Integrated
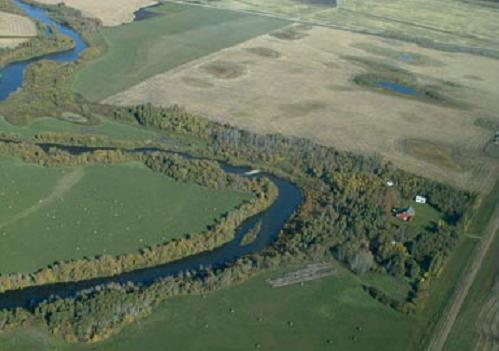
Learning." A riparian area is a
strip of vegetation along the edges of a stream or river. It is represented in the photograph below by the strips of shrubs and trees on the riverside. It absorbs
nutrients before they enter the water, slows the flow of water into the river,
lowers the stream temperature, and provides habitat for vertebrates and
invertebrates, aquatic and terrestrial alike. Rivers that lack riparian zones show increased nutrients and algae, increased temperature, and decreased shade and dissolved oxygen, all of which are bad for aquatic life. The great thing about riparian areas from the educational perspective is that they are easy to study, and the data you collect is able to be analyzed by students to assess the health of the stream. You can find a very brief summary of this technique here.
Coordinating the RAIL Project
I needed the kids to collect data on the physical stream characteristics, water chemistry, macroinvertebrates (insects and other critters in the water), vertebrates, and vegetation. They would don waders and goggles, use kick-nets, collect and identify critters, work with chemical testing kits, learn to identify birds and a variety of mammals from scat, calculate discharge by measuring stream dimensions and velocity, take photographs, and record it all down to analyze in the classroom. All this needed to take place at the same time, in the same general location, and take less than one hour.
Yikes.
First students had to be trained in their tasks, and as much as possible needed to be done inside before we even tried to go into the water. There are five crews: Macroinvertebrates, Vertebrates, General Stream, Water Quality, and Photography. Each crew has its own goals. (For detailed descriptions of the responsibilities and materials of each crew, I'll write up another blog post.)
Since the macroinvertebrate crew had to identify critters in the water, I set up computers in the classroom with slideshows of various inverts, and gave the crew some identification field guides that they needed to use to correctly identify the invertebrates. They found this to be challenging but fun. The vertebrate crew had very much the same task, only their slideshows were of amphibians, birds, snakes, turtles, and mammals. I also made sure to include slides of scat (poop) and tracks that students tried to identify. The general stream crew was one of the more interesting groups to train, because how do you show kids how to measure physical stream dimensions inside the classroom? I built a simple water flume out of a gutter from Home Depot and set it up between two sinks; one of the sinks poured water into the raised end, while the water flowed down into the basin of the other sink. Students were then able to use rulers and timers to measure the width, depth, and velocity of the water. From that they could calculate discharge, or how much volume of water passes through in a certain amount of time. The water quality crew needed to be able to use a water testing kit, so each training day I gave them a different sample of water to test, and some days I mixed in tap water or a few teaspoons of fertilizer to throw off their measurements. Lastly, the photography crew needs to make a visual record and also write down a detailed description of certain locations in the area. More slides and another computer for this.
So we spent two or three days in the classroom practicing. Then we had to go out and coordinate our efforts outside, which was a chaos at first because students were timid and didn't want to mess up the work (I give them credit for this). The first two field outings were practice, but the third and onward were all "official," and we were able to use our data to start making conclusions.
Once the students were comfortable with the fieldwork, we went out once or twice a week from October 8 through November 2 (totaling 6 official fieldwork days). The weather was our principle enemy, and we sometimes had to put off fieldwork days and do alternative assignments.

The two others standing toward the left are getting ready for the net to come out with its sample, so they can identify and tally up the species. These data are recorded and analyzed later.

At right, more students are preparing to enter the water with D-nets, which they can use to scoop up any macroinvertebrates that the kick-nets miss, or to get ones that are able to avoid the net, such as water-striders.
The suburb in the background is upstream, so the runoff from the lawns is flowing down toward where the crews are working. We compared river health both upstream and downstream.

Toward the center of the photograph, you can see one of the PVC pipe stakes that I used to help students identify that portion of the study site.

Making Conclusions
Students were able to conclude what this meant for our stream: It turned out to be pretty "unhealthy," and this was most likely due to all the upstream lawn runoff and nutrients from the suburbs and even farmland farther up north.
Students knew that too much nitrogen and phosphorous in river water could lead to a process called eutrophication, in which algae grow too much, die, and are then decomposed by bacteria. A eutrophic stream or lake is green, stinky, slimy, and oxygen-impoverished, so these aquatic environments don't have a high biodiversity, which makes them less stable to disturbances. They are also just gross.
Student conclusions could have been offered in an essay or research project format, but because we were running out of time (I had too many irons in the fire at once), we just discussed our findings as a class and related them to what we already knew about ecology. This year I plan to let students go into much greater depth. They will write essays and offer their own research proposals on what else we could find out by doing more fieldwork. Or, they could offer other conclusions that we did not originally seek, by doing a different analysis of the data we have already collected.

The dragonfly larva above is eating an aquatic worm, just one of the ecological interactions that can be investigated in something like the RAIL Project (Image source).
Other Applications
The possibilities here are endless, and the RAIL Project can extended in a number of ways, to other environments. Woodlots and fields are great places to do the same basic kind of project. Students can do quadrat sampling of herbaceous (soft plants) and silvic (tree-like plants) vegetation and do other statistical analyses based on these data. In many ways, a terrestrial project like this would be simpler to coordinate than the RAIL Project. Students can survey the weeds on a plot of grass or along a roadside ditch. You could even encourage them to do research on their own laws! Trust me, some of these kids take this experience home and can't stop talking about it. If you teach, I encourage you to try a project like this when you can.
Pretty cool project. Anyone interested in getting curriculum and resources to start this, please give me an email at piccarke@gvsu.edu and be looking for one of our upcoming publications that will be coming out in Science Scope Journal.
ReplyDeletePiccard, Keith J., Stephen M. Rybczynski, and Peter E. Riemersma. (In prep) "Wading into Ecology: A lesson in ecosystem attributes of aquatic systems." Science Scope . Print.
Keith! How did you spot my blog? Great to hear from you, and the RAIL Project this year is going excellently! I can send you last year's complete data (I don't think I ever did), and this year's data is coming along really nicely. Integrating a lot of curriculum into the project, more than I did last year. I'll see if I can get hold of a copy of Science Scope; I've heard of it several times. Thanks for the comment and I'll be contacting you pretty soon! ~Alex.
DeleteThis comment has been removed by the author.
ReplyDelete